This article provides a month-by-month breakdown of the weather in Panama City Beach, Florida, using historical data sourced from the National Oceanic and Atmospheric Administration (NOAA). The data has been averaged over the following time periods.
- Air Temperature and Precipitation (1991-2020). A note here that “rain days” must have recorded at least 0.01 inches of rain.
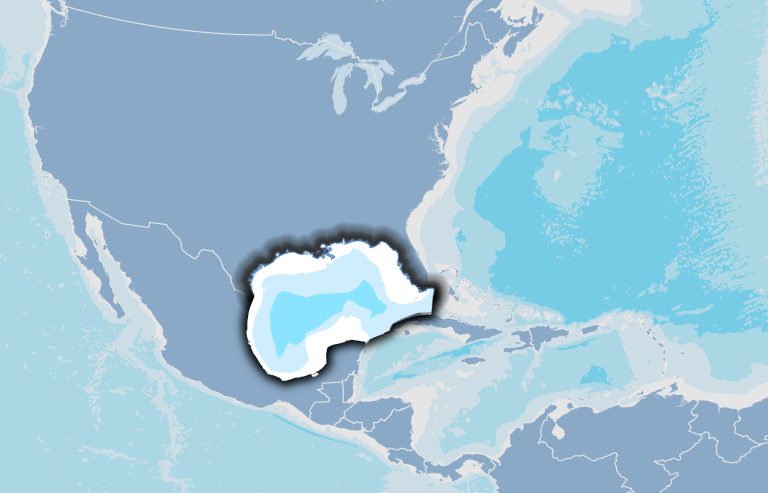
- Gulf Water Temperature (1994-2024). Taken just off shore.
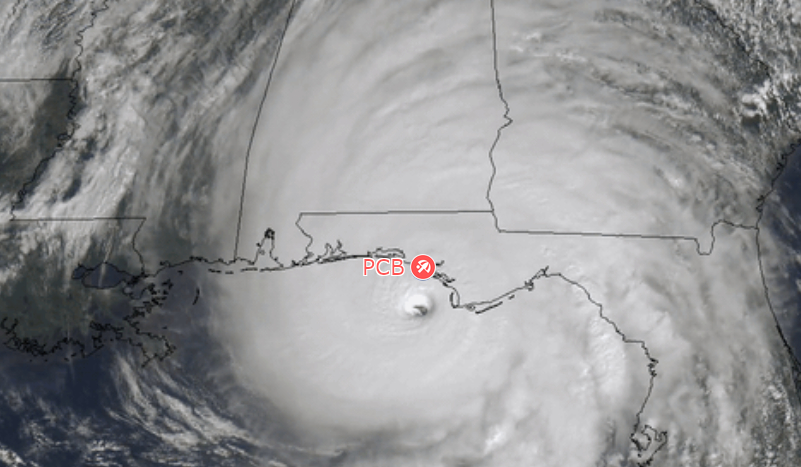
- Hurricane Probabilities (1944-1999): Hurricanes Eloise (1975), Opal (1995) and Michael (2018) are the only recorded major hurricanes to hit the region.
January
As the coldest month, January in Panama City Beach offers a mild winter experience, with temperatures rarely dipping below 42°F. Despite being the coolest, it has a relatively modest amount of rainfall. On average it rains 28% of days in the month, which means a week vacation is likely to have 2 rain days.
- Average High: 64.4°F
- Average Low: 42.6°F
- Overall Average: 53.5°F
- Gulf Water Temperature: 59.6°F
- Total Precipitation: 4.79 inches
- Average Rainy Days: 8.7
February
February sees a slight rise in temperatures, signaling the gradual approach of spring. Rainfall is consistent, but not excessive, making outdoor activities generally enjoyable. On average, it rains 27% of days in the month, which means a week vacation is likely to have 2 rain days.
- Average High: 67.4°F
- Average Low: 46.0°F
- Overall Average: 56.7°F
- Gulf Water Temperature: 60.1°F
- Total Precipitation: 4.95 inches
- Average Rainy Days: 7.6
March
March marks a noticeable transition towards warmer weather, ideal for early spring outdoor activities. Rainfall remains moderate, maintaining the lushness of the region. On average, it rains 22% of days in the month, which means a week vacation is likely to have less than 2 rain days.
- Average High: 72.9°F
- Average Low: 51.5°F
- Overall Average: 62.2°F
- Gulf Water Temperature: 64.7°F
- Total Precipitation: 5.03 inches
- Average Rainy Days: 6.9
April
With a significant increase in temperature, April in Panama City Beach is truly spring-like. Rainfall is at one of its lowest points, making it a great time for beach visits. On average, it rains 20% of days in the month, which means a week vacation is likely to have less than 2 rain days.
- Average High: 78.7°F
- Average Low: 57.8°F
- Overall Average: 68.2°F
- Gulf Water Temperature: 70.0°F
- Total Precipitation: 4.09 inches
- Average Rainy Days: 6.0
May
May showcases warm temperatures and low rainfall, perfect for enjoying the full bloom of spring and early beach days. On average, it rains 17% of days in the month, which means a week vacation is likely to have 1 rain day.
- Average High: 85.3°F
- Average Low: 65.6°F
- Overall Average: 75.5°F
- Gulf Water Temperature: 76.8°F
- Total Precipitation: 3.31 inches
- Average Rainy Days: 5.4
June
June ushers in the summer with higher temperatures and an increase in rainy days, indicating the start of the more humid season. On average, it rains 30% of days in the month, which means a week vacation is likely to have 2 rain days. June is the start of the Atlantic hurricane season. While it’s hurricane season, there’s only about a 4-6% chance of a storm impacting PCB.
- Average High: 89.3°F
- Average Low: 72.9°F
- Overall Average: 81.1°F
- Gulf Water Temperature: 81.7°F
- Total Precipitation: 5.82 inches
- Average Rainy Days: 10.8
July
July is the peak of summer heat and also brings the most rainfall, making it a humid but vibrant month for beachgoers and water activities. On average, it rains 40% of days in the month, which means a week vacation is likely to have 3 rain days. Most areas in the Atlantic see an increase in hurricanes, but PCB has only about a 2-4% historical chance of a storm impact.
- Average High: 91.1°F
- Average Low: 75.0°F
- Overall Average: 83.0°F
- Gulf Water Temperature: 84.0°F
- Total Precipitation: 7.41 inches
- Average Rainy Days: 12.4
August
August remains very warm and tops the charts in rainfall, making it the rainiest month. The high humidity during this month is characteristic of Florida summers. On average, it rains 48% of days in the month, which means a week vacation is likely to have 3 or more rain days. Atlantic hurricane season is reaching its peak, but there’s still only about a 6% chance of a storm impacting the area.
- Average High: 90.9°F
- Average Low: 74.7°F
- Overall Average: 82.8°F
- Gulf Water Temperature: 85.4°F
- Total Precipitation: 7.44 inches
- Average Rainy Days: 13.6
September
September sees a slight drop in temperatures and rainfall, signaling the end of the peak summer season, with more comfortable conditions setting in. On average, it rains 32% of days in the month, which means a week vacation is likely to have 2 rain days. Atlantic hurricane season is at its peak, there’s a 10-12% chance of a storm impacting the area at this time.
- Average High: 89.0°F
- Average Low: 71.1°F
- Overall Average: 80.1°F
- Gulf Water Temperature: 83.8°F
- Total Precipitation: 6.98 inches
- Average Rainy Days: 9.6
October
October offers a noticeable retreat from summer heat, with moderate temperatures and reduced rainfall, marking the onset of a pleasant fall season. On average, it rains 18% of days in the month, which means a week vacation is likely to have 1 rain day. Atlantic hurricane season is past its peak, there’s again a 6% chance of a storm impacting the area during October.
- Average High: 82.2°F
- Average Low: 61.2°F
- Overall Average: 71.7°F
- Gulf Water Temperature: 77.9°F
- Total Precipitation: 3.45 inches
- Average Rainy Days: 5.6
November
In November, temperatures continue to cool, providing a mild and comfortable climate with relatively low rainfall, ideal for outdoor autumn activities. On average, it rains 19% of days in the month, which means a week vacation is likely to have 1 rain day. November marks the last month of Atlantic hurricane season, there’s less than a 2% chance of a storm impacting the area in this month.
- Average High: 73.3°F
- Average Low: 50.1°F
- Overall Average: 61.7°F
- Gulf Water Temperature: 69.8°F
- Total Precipitation: 3.70 inches
- Average Rainy Days: 5.7
December
December brings cooler temperatures, rounding off the year with a mild winter setting. Rainfall is moderate, maintaining the area’s lush environment. On average, it rains 25% of days in the month, which means a week vacation is likely to have 2 rain days.
- Average High: 66.5°F
- Average Low: 45.1°F
- Overall Average: 55.8°F
- Gulf Water Temperature: 63.2°F
- Total Precipitation: 4.30 inches
- Average Rainy Days: 7.9
Data from NOAA:
- https://www.ncei.noaa.gov/access/services/data/v1?dataset=normals-monthly-1991-2020&startDate=0001-01-01&endDate=9996-12-31&stations=USC00086842&format=pdf
- https://www.ncei.noaa.gov/access/coastal-water-temperature-guide/all_table.html#egof
- https://www.aoml.noaa.gov/wp-content/uploads/2019/03/Named_Sorm_Probs.jpg


